[CS231n review] Lecture8 - Localization & Detection

Stanford CS231n(2016)를 학습하며 정리 및 추가한 내용입니다.
Localization & Detection
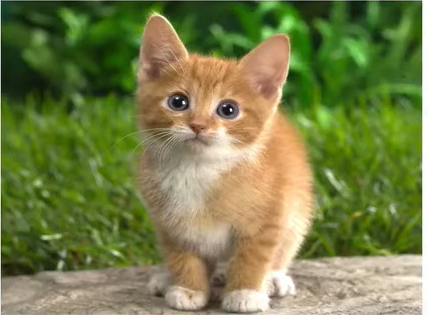
지금까지 배운 Classification은 아래의 Image를 ‘고양이’라고 labeling했습니다.
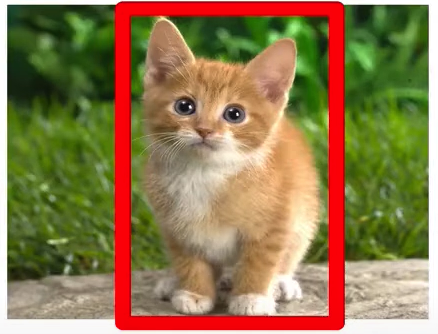
이 Classification에 localization을 더하면 아래처럼, 고양이가 있는 부분을 박스로 표시할 수 있습니다.
이 박스는 boundry box라고 칭합니다.
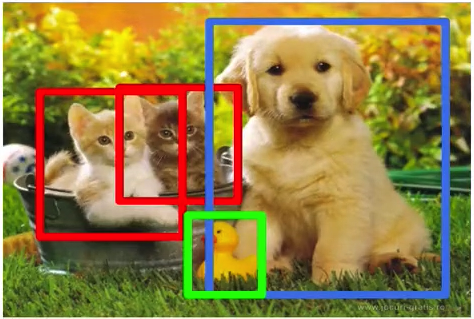
Object Detection이란 multiple object가 있을 때 여러 object를 찾아내는 것을 말합니다.
아래의 사진처럼 object를 형상으로 따주는 것을 segementation이라고 합니다.
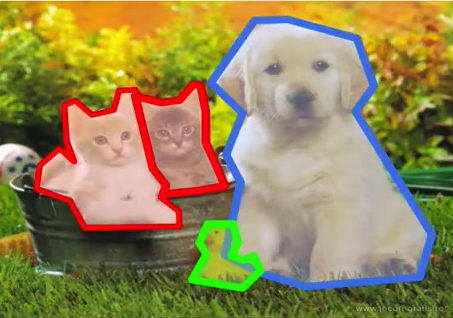
아래로 갈수록 컴퓨터 입장에서 더 어렵다고 말할 수 있습니다.
해당 강의에서는 segementation을 제외한 localization와 segementation에 대해 학습합니다.
해당 강의의 순서를 간단하게 보면 아래와 같습니다.
Localization as Regression
Sliding Window : Overfeat
Detection as Classification
Region Proposal : Selective Search
R-CNN
Fast R-CNN : Region of Interest Pooling
Faster R-CNN : Region Proposal Network
Detection as Regression : YOLO
강의자료, 강의시간은 이전과 사이즈가 크게 다르지않지만, 각각의 개념이 가지는 정보량이 많아 오래 걸렸습니다.
강의의 취지에 맞게 디테일한 부분은 추후에 논문 리뷰를 통해 알아보는 것으로 하고 개괄적인 localization과 detection을 시간의 흐름에 따라 리뷰해보도록 하겠습니다.
Localization

classification에서 고양이 사진을 고양이로 분류하고, Localization을 통해 고양이가 어느 위치에 있는지 알 수 있어야합니다.
Localization에 대한 아이디어는 Localization as Regression, Sliding Window 총 2개입니다.
먼저 Localization as Regression에 대해 살펴보겠습니다.
Localization as Regression
Localization as Regression을 간단하게 설명하면, Input으로 Image를 받으면, Localization은 Box의 좌표$(x,y,w,h)$ 좌표를 Output으로 내놓습니다.
예측한 Box 좌표와 정답 Box 좌표를 비교하여 L2 distance Loss를 구하여 학습합니다.

Localization as Regression을 단계적으로 살펴보겠습니다.
1단계는 먼저 Classification model을 학습합니다.
이전의 강의에서 배운대로 동일하게 CNN을 활용하여 Classification model을 학습합니다.
이를 Classification head라고 합니다.
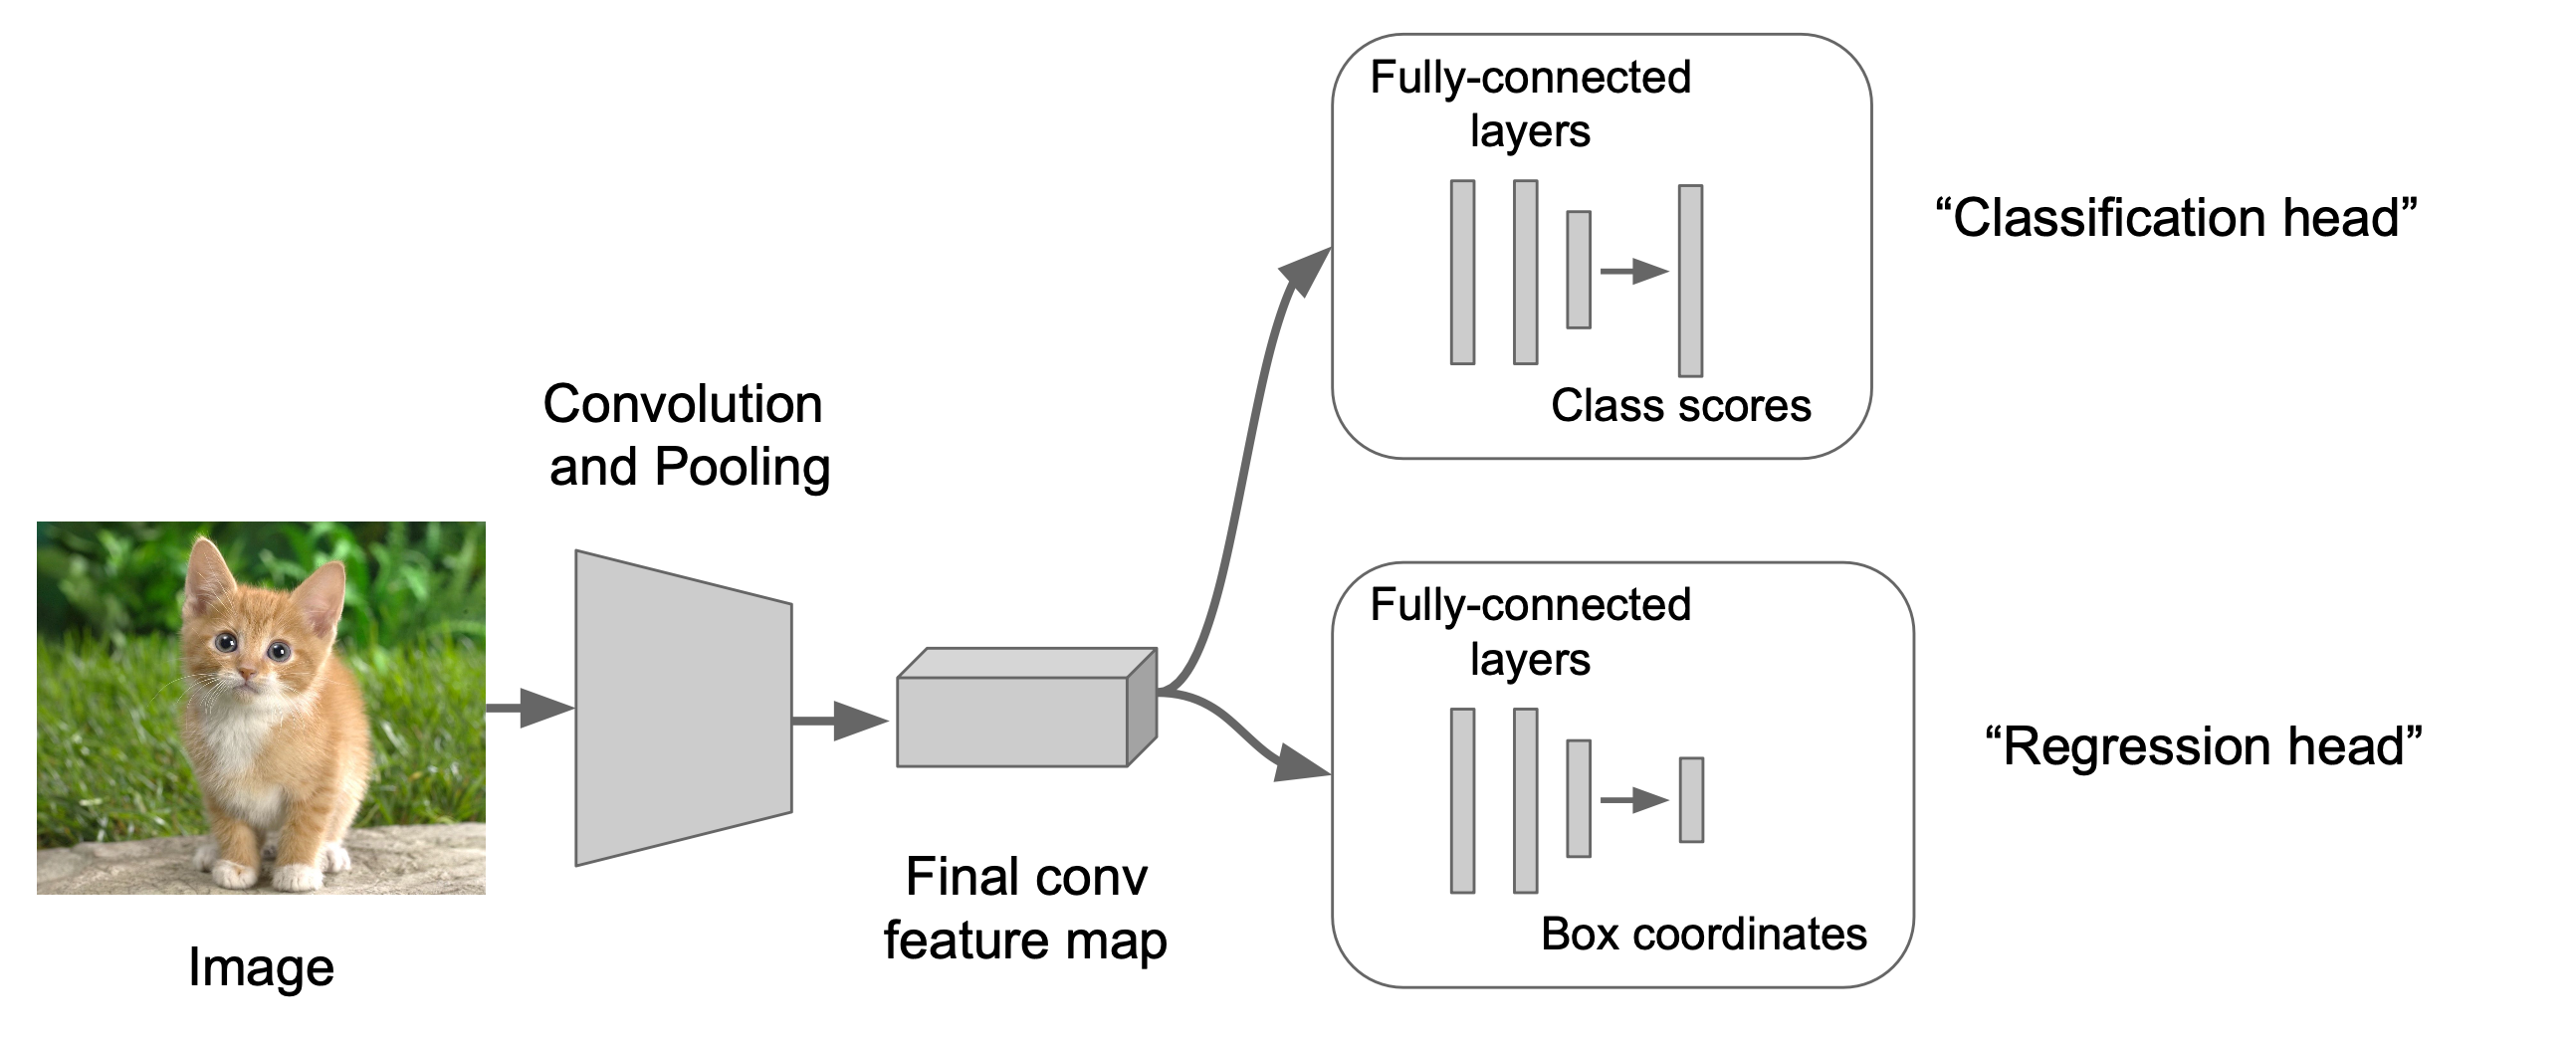
2단계에서는 Regression head를 추가합니다.
해당 Regression head에서 Box의 좌표를 output으로 내놓습니다.
다음 3단계에서는 위의 regression head를 훈련시킵니다.
마지막으로 Regression head와 Classification head를 둘 다 이용하여 결과물을 산출합니다.
Regression Head에는 Class agnostic 방법과 Class specific 방법이 있습니다.
Class agnostic은 좌표 하나를 산출하고, Class specific 은 class 당 좌표 하나를 산출합니다.
예를 들어, Classification에서 Cat일 확률이 가장 높더라도, Class specific은 Cat의 좌표와 Dog의 좌표를 각각 class 별로 산출합니다.
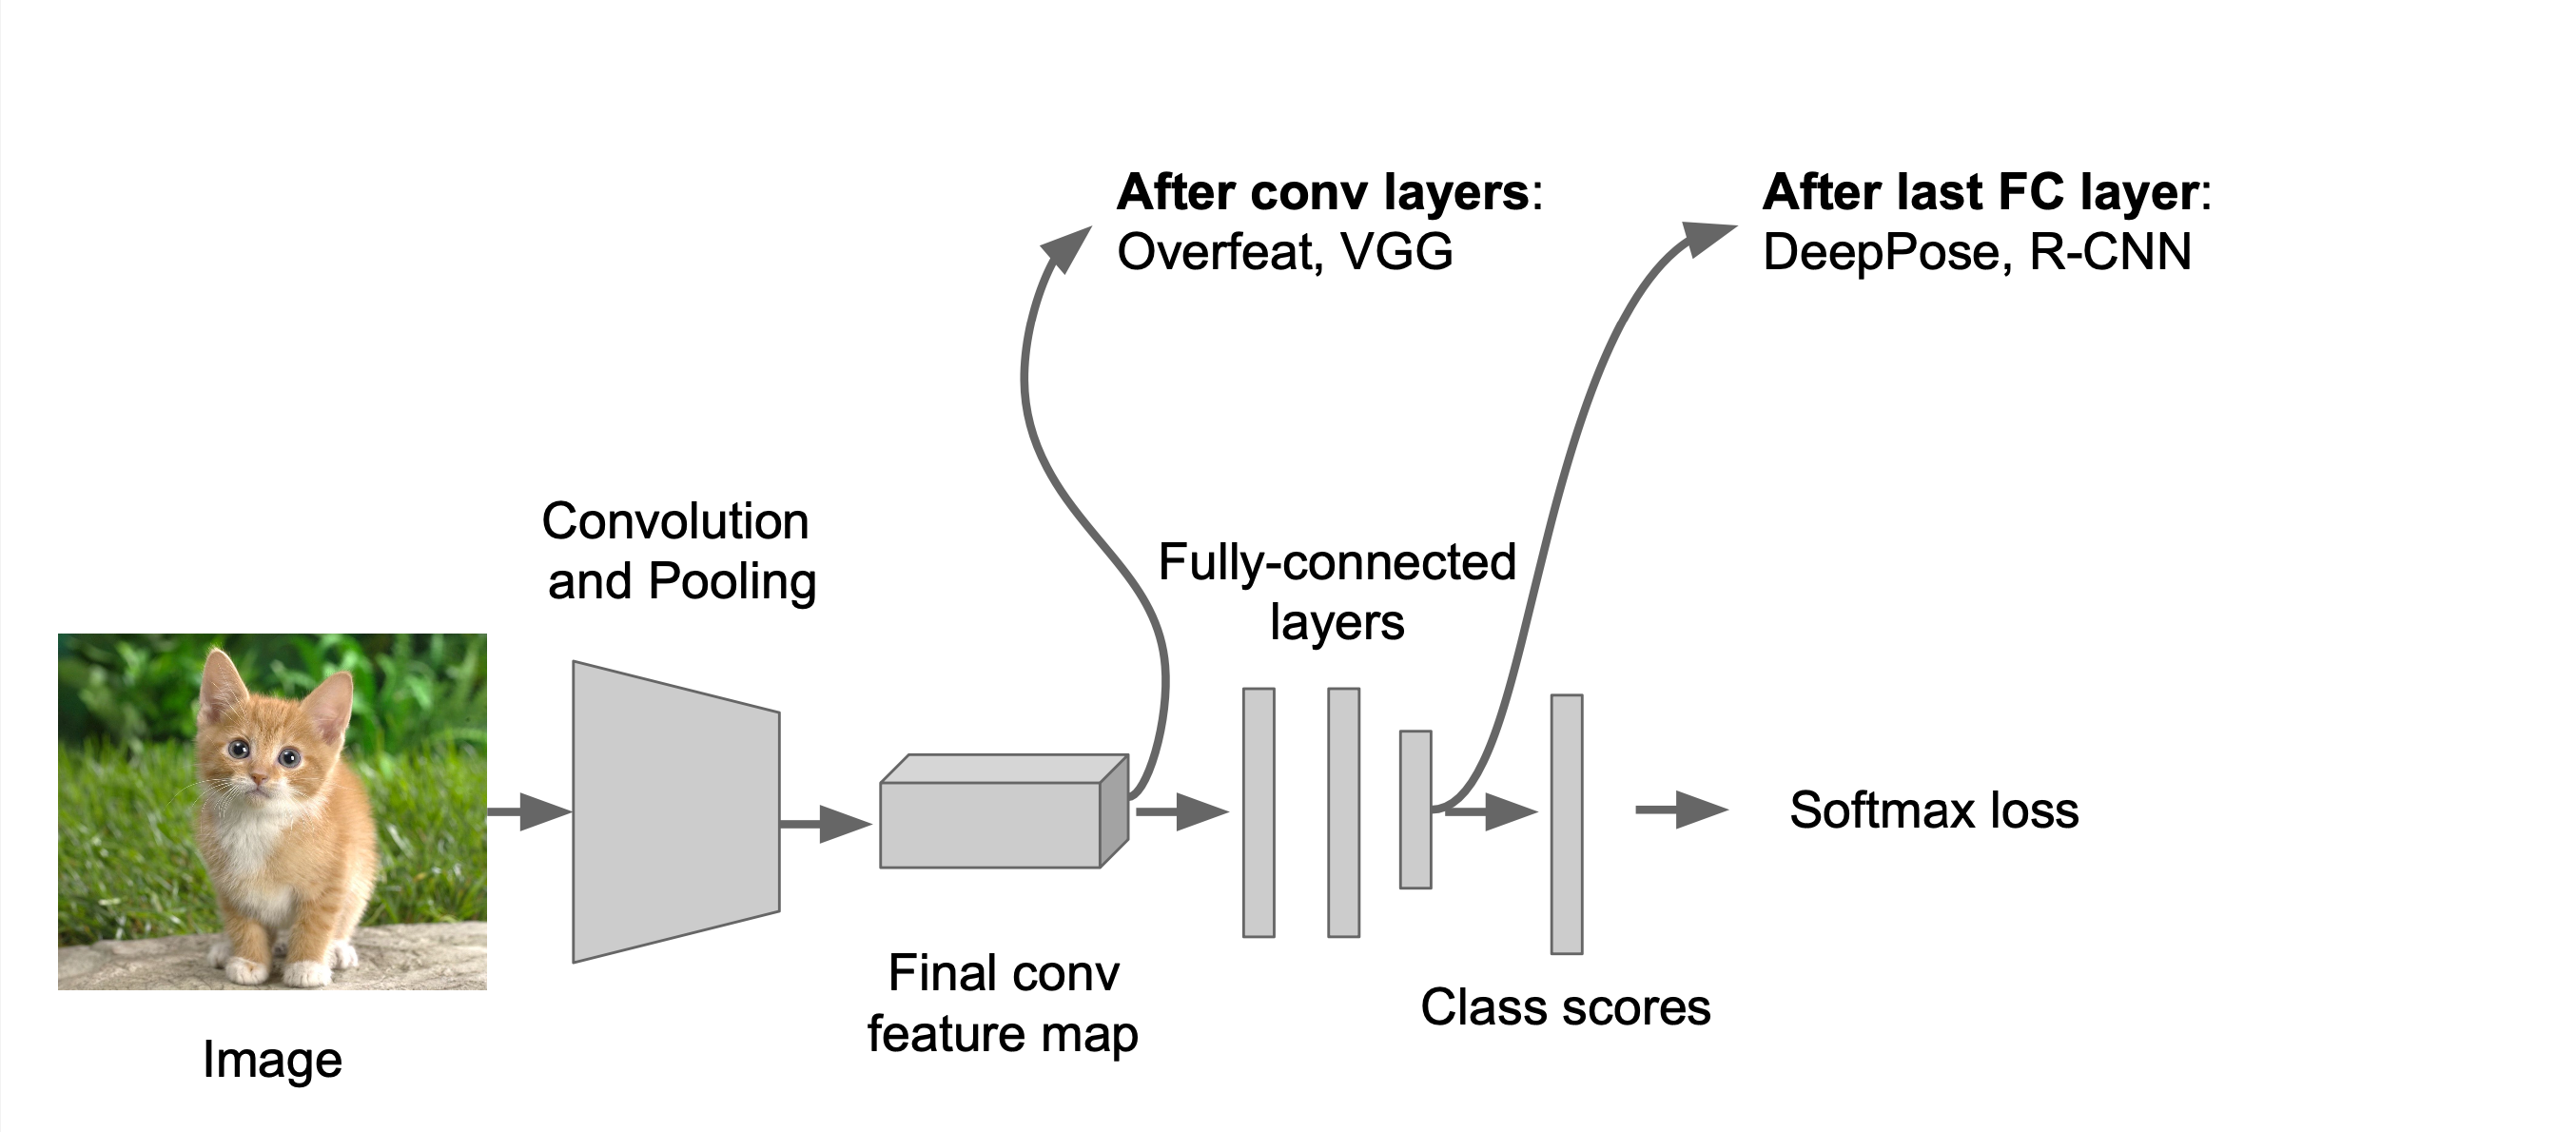
또한, Regression head 를 붙이는 방법은 conv Layer 뒤에 붙이는 방법과 FC layer 뒤에 붙이는 두가지 방법이 존재합니다.
Sliding Window

두번째 방법은 Sliding Window입니다.
스터디 속기록
Localization as Regression 방법에서는
Computer Vision Tasks (유사 개념들의 차이점)
Classification : 이미지 labelling
Classification + localization : labelling + boxing
Object Detection : 여러개의 object 찾아냄
Instance Segmentation: 형상대로 따줌
Classification + Localization: Task
Classification: C classes
Input: Image Output: Class label Evaluation metric: Accuracy
Localization:
Input: Image Output: Box in the image (x, y, w, h) Evaluation metric: Intersection over Union (IoU, 겹치는 부분이 몇 %인지)
Classification + Localization: Do both (label + box)
Classification + Localization: ImageNet
- 1000 classes (same as classification)
- 각 이미지는 1개의 class와 적어도 1개의 bounding box를 가짐
- class 당 800개의 training image
- 적어도 하나를 guess하고, IoU>0.5이면 맞춘 걸로 간주함
- Localization 하는 방법 ① Localization as Regression
-
simple하고 나름 강력한 방법, 여러 사례에 응용 가능
output : 4개의 숫자로 구성된 box의 좌표를 얻음, correct output : ground truth box 좌표와 비교 L2거리를 활용하여 Loss 구함
Classification + Localization
Step 1: Train (or download) a classification model
Step 2: Attach new fully-connected “regression head” to the network
결과물이 box 좌표로 오도록 regression head를 추가함
Step 3: Train the regression head only with SGD and L2 loss
추가한 regression head 부분만 학습
Step 4: At test time use both heads
classification head와 regression head 모두를 이용해서 결과물 산출
Regression Head 부분의 2가지 방법
- Per-class regression (class specific)
- class에 특화된 방법
- 각 class 당 하나의 박스 (각 class당 4개의 숫자)
- loss 계산 시 ground truth class의 좌표만 이용
- class agnostic regression
- 각각 class와 무관한 (범용적인) 방법
- 하나의 box (4개의 숫자)만 결과물로 나옴
Where to attach the regression head?
- 마지막 conv layer 뒤
- fully connected layer 뒤
참고: multiple object를 localization
정해진 수 (exactly K)의 object를 찾아내는 것은 regression 만으로도 잘 동작함 (detection 굳이 사용하지 않아도 됨)
참고: Human Pose Estimation
자세 이용해서 관절 표시 - regression 이용해서 쉽게 구현 가능
Localization 하는 방법 ② Sliding Window
-
- Run classification + regression network at multiple locations on a high-resolution image
-
classification head와 regression head로 분리해서 진행하지만 이미지의 여러 위치를 여러번 돌려서 합쳐주는 기법
- fully-connected layer를 conv layer로 변환해서 연산 진행
- Overfeat (대표적인 sliding window)
-
classification head와 regression head 2가지로 구분 2013년 우승 모델, 크기가 더 큰 image 일수 정확도가 높음
ex) sliding window를 4개로 구현한 예시

AlexNet 이미지 크기 정확히는 3x227x227
-
검은색 박스가 sliding window임. regression head에 의해 빨간색 bounding box를 만들게 되고 classification head에 의해서 고양이로 분류하는 score (0.5)를 계산
-
sliding window를 약간 옮겨줌, bounding box와 점수 계산. 이를 반복
-
최종적으로 4개의 bounding box와 4개의 점수를 얻게 됨
-
4개를 합쳐서 단일 bounding box와 단일 점수를 얻게 됨
실제로는 수십~수백개의 sliding window를 사용함. 이를 통해 score map 작성
수많은 sliding window를 사용하게 되면 연산 자체가 heavy 해지는 문제 발생
→ 뒷단의 FC layer를 conv layer로 바꿔줌으로써 연산을 효율적으로 진행함
FC layer는 4096개의 원소로 구성된 벡터. 이를 convolutional feature map으로 생각하기 위해 transpose 해주고 1x1차원을 추가하여 conv layer로 구성해줌
Efficient Sliding Window: Overfeat
- 14x14 이미지를 받아서 5x5 filter로 convolution 해줌
- ((14-5)/1) + 1 = 10, 따라서 10x10 으로 변경됨
- 이를 2x2 filter로 pooling 해주면 5x5
-
((5-5)/1) + 1 = 1, 따라서 1x1을 가지도록 변환됨
- test time에서는 training time 보다 큰 이미지를 사용함
- 16x16 이미지를 5x5로 convolution 시켜서 (16-5)/1 + 1 = 12 즉, 12x12 가 됨
- 이를 2x2로 pooling 하면 6x6
- 5x5 conv을 적용하면 2x2로 변환됨
Classification과 Localization의 ImageNet의 성적

- AlexNet: Localization method not published
- Overfeat: Multiscale convolutional regression with box merging
- VGG: Same as Overfeat, but fewer scales and locations; simpler method, gains all due to deeper features, accuracy 측면에서 VGG는 localization에서 1등을 차지
- ResNet: Different localization method (RPN, Regional Proposal Network) and much deeper features
Object Detection
regression을 detection에서도 활용한다면?
이미지에 따라서 object의 개수가 달라지기 때문에 결국 output의 개수가 달라짐
→ regression이 detection에서는 적당하지 않음
→ YOLO (You Only Look Once): 그럼에도 불구하고 regression 사용해서 detection을 함
- Detection as Classification
-
이미지 각각의 다른 부분에 대해 classifier를 돌림으로써 output의 사이즈 변하는 것을 해결
Classification 기반으로 detection을 접근했을 때의 문제
① 너무 많은 위치와 scale에 대해 test를 해야함
→ solution: If your classifier is fast enough, just do it.
② CNN같은 무거운 classifier를 사용해야 하는 경우, 모든 위치와 scale을 보기에 좋지 않음
→ 의심되는 위치만 확인하는 region proposal 방식 활용
region proposal
- 뭉쳐있는 영역 (”blobby”)을 찾는 것
- Class-agnostic object detector
- region proposal - Selective Search
-
색상/텍스처가 유사한 픽셀끼리 묶음 → merge 해서 점점 큰 blob을 만듦
Histogram of Oriented Gradients (HOG)
Deformable Parts Model (DPM) : HOG기반
Aside: Deformable Parts Models (DPM) are CNNs? DPM은 Conv Neural Net의 한 종류임
Region Proposal + CNN → R-CNN (Region-based CNN)
이미지 내의 bounding box를 region proposal을 이용해 2000개로 줄임
R-CNN Training
Step 1: Train (or download) a classification model for ImageNet (AlexNet)
Step 2: Fine-tune model for detection
-
Instead of 1000 ImageNet classes, want 20 object classes + background
-
Throw away final fully-connected layer, reinitialize from scratch
-
Keep training model using positive / negative regions from detection images
Step 3: Extract features
- Extract region proposals for all images
- For each region: warp to CNN input size, run forward through CNN, save pool5 features to disk
- Have a big hard drive: features are ~200GB for PASCAL dataset!
Step 4: Train one binary SVM per class to classify region features
Step 5 (bounding box regression): For each class, train a linear regression model to map from cached features to offsets to GT boxes to make up for “slightly wrong” proposals
→ mAP (mean Average Precision)이 3~4% 정도 올라가는 효과
Object Detection 관련 Datasets
+) 2016 구글 - Open Images Dataset
Object Detection: Evaluation 방법: mAP (mean Average Precision
- 각각의 class에 대해 AP (Average Precision)를 구한 후 class에 대해 평균을 냄
- detection이 positive한 경우, IoU 값이 0.5가 넘으면 맞췄다고 판정
- 모든 test image를 detection한 것에 대해 (precision)/(recall) curve로 나타냄
- curve 아랫부분 넓이는 AP 임
- mAP는 0에서 100 사이의 숫자로 나타남. 높을수록 좋음
R-CNN Results
R-CNN의 약점
- test time 시에 매우 느림: 2000개의 region proposal에 대해 Foward Pass로 CNN을 돌려야하기 때문에 무겁고 느림
- SVM과 regressor의 반응에 기반에 바로 업데이트 되면 좋겠지만 그렇지 않음 (post-hoc)
- 다단계의 training pipeline을 가져서 복잡함
- Fast R-CNN 등장 : CNN을 먼저 돌린 후 region 추출함 (순서 반대)
-
이미지를 ConvNet에 먼저 돌림으로써 고해상도의 feature map 생성, 이에 대해 region proposal method를 활용해 RoI 추출함 (”RoI Pooling 기법 활용”),
- R-CNN은 각각의 region들이 Forward Pass를 거쳐야해서 test time 에서 느렸지만, Fast R-CNN에서는 region proposal을 선택하기 전에 Conv를 돌림으로써 computation을 share하게 됨
- R-CNN의 경우 즉각적으로 업데이트 할 수 없었고, training pipeline이 복잡하다는 단점이 있었지만, Fast R-CNN에서는 전체 시스템을 end-to-end로 한꺼번에 학습시켜서 매우 효율적임
Fast R-CNN: Region of Interest Pooling (”RoI Pooling”)
FC layer는 low-res conv feature를 원해서 상충이 일어남. 이를 RoI Pooling이 해결
Fast R-CNN Results
Fast R-CNN test time의 속도가 매우 빨라짐. R-CNN의 경우 각각의 region proposal에 대해 별개로 forward pass를 돌려서 매우 느림 Fast R-CNN의 경우 region proposal 간의 conv layer의 computaton을 share하기 때문에 빠름 정확도(mAP)에 있어서도 Fast R-CNN이 높음
Fast R-CNN의 한가지 문제: test time speed는 region proposal 과정을 포함하고 있지 않음
region proposal time 포함하면 2초나 걸림
→ 이에 대한 해결책: Region proposal에도 CNN을 적용해보자 → Faster R-CNN
- Faster R-CNN
-
더이상 region proposal을 외부에서 진행하지 않음 RPN(Region Proposal Network)을 제일 마지막에 있는 conv layer에 삽입, RPN 이후의 과정은 Fast R-CNN 과정과 동일

Faster R-CNN: Region Proposal Network
Slide a small window on the feature map
Build a small network for: • classifying object or not-object, and • regressing bbox locations
Position of the sliding window provides localization information with reference to the image
Box regression provides finer localization information with reference to this sliding window
Use N anchor boxes at each location
Anchors are translation invariant: use the same ones at every location
Regression gives offsets from anchor boxes
Classification gives the probability that each (regressed) anchor shows an object

feature map에서 3x3의 sliding window

Faster R-CNN: Training
- 최초의 논문에서는 pipeline이 복잡했음
- Use alternating optimization to train RPN, then Fast R-CNN with RPN proposals, etc.
- More complex than it has to be
- Since publication: Joint training!
- One network, four losses
- RPN classification (anchor good / bad)
- RPN regression (anchor -> proposal)
- Fast R-CNN classification (over classes)
- Fast R-CNN regression (proposal -> box)
Faster R-CNN: Results

YOLO: You Only Look Once : Detection as Regression
- 이미지를 7x7의 grid로 나눔
- 각 grid cell에서 4개의 좌표와 confidence를 가지는 B개의 box들, class score를 나타내는 C개의 숫자들을 예측하게 함
- 이미지로부터의 regression이 7 x 7 x (5*B+C) tensor
- 성능: Faster R-CNN보다 빠르지만 정확도 측면에서 떨어짐